
Reading the gap: the call list, your accounts, and the leak
What each part of the Territory page is telling you, what the dollar figures are and are not, and the one thing to do first.
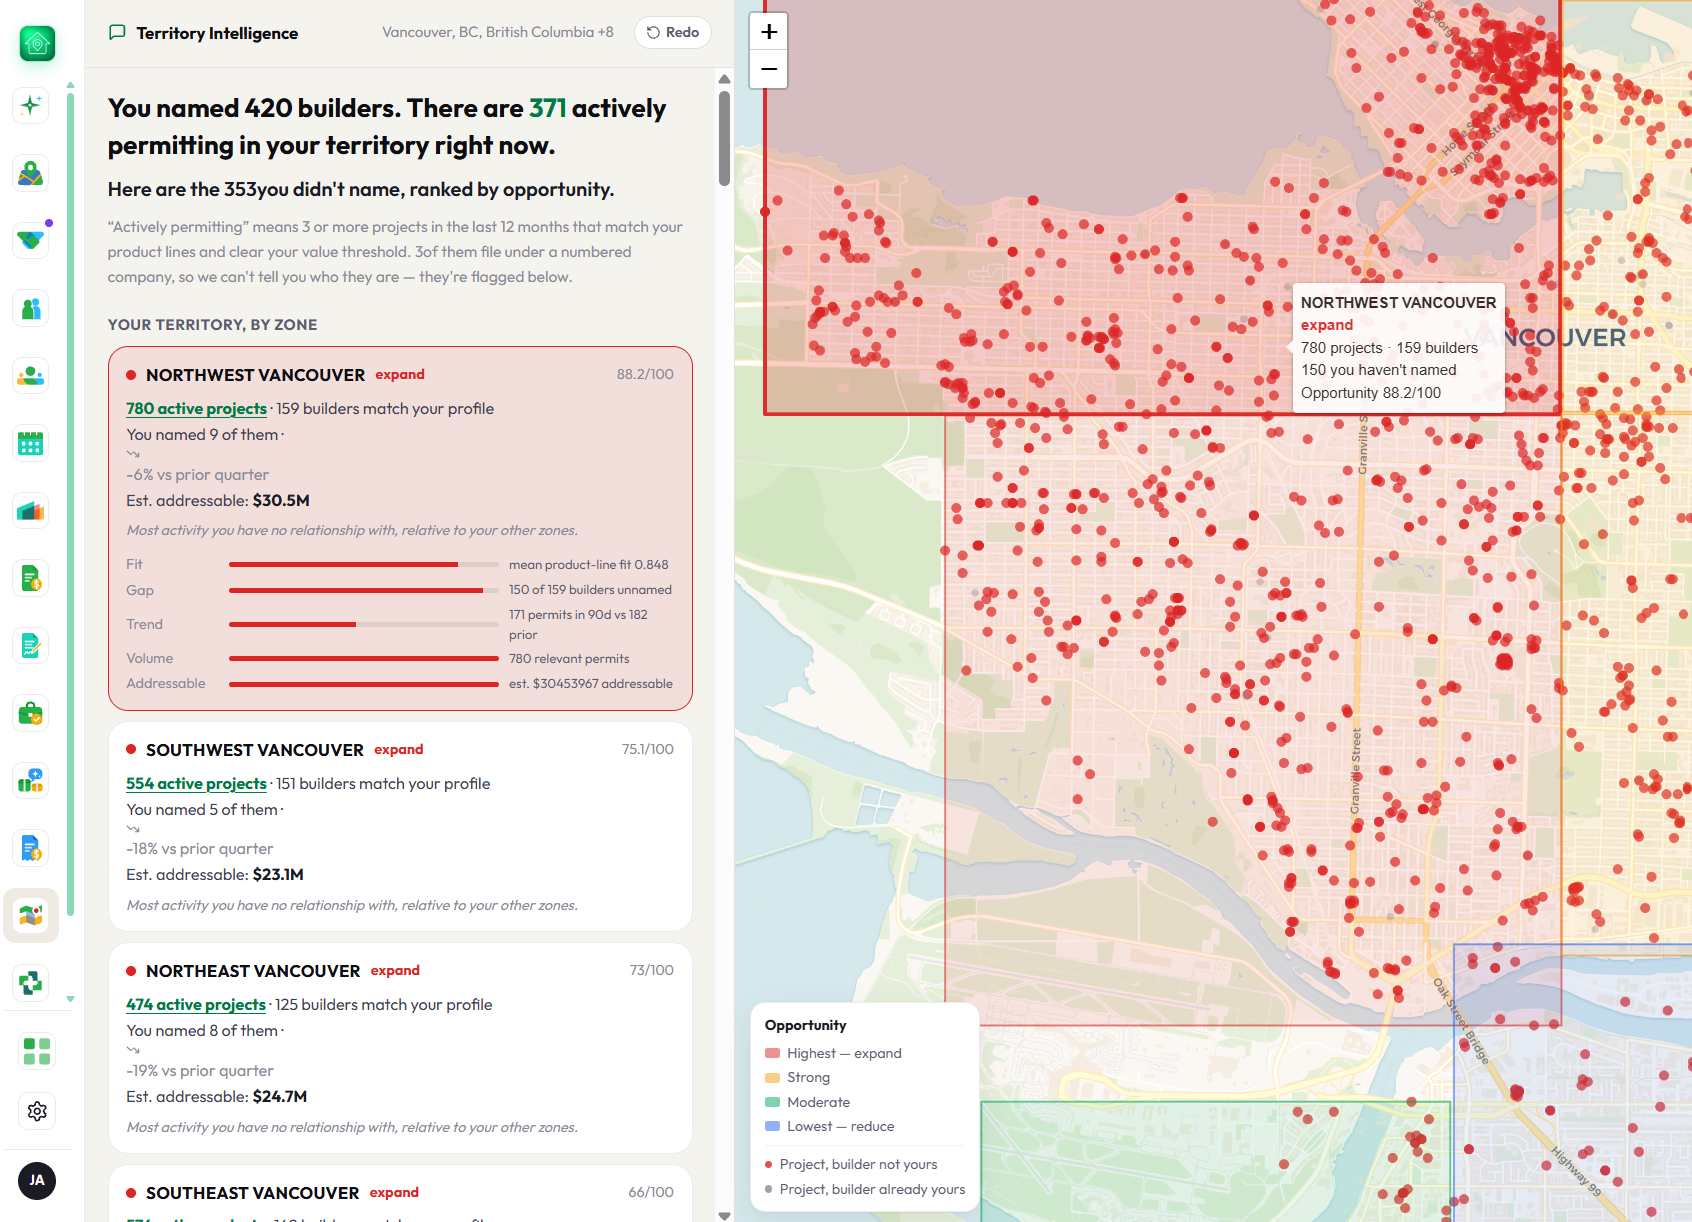
The page reads your territory out loud: loading permit activity, filtering to projects your lines go into, identifying active builders, matching your named accounts, scoring zones. Then two tabs: The gap, which is where it opens, and Your accounts, which appears once you have given it a customer list. Ask, a chat over all of it, is the button in the header. Here is how to read them, in the order a manager should.
One rule for every dollar
Every figure on this page is your share of the build, never the project's value and never your revenue. The strip under the headline says which share is in use (the industry assumption, measured from your jobs, or your own number) and lets you change it. When a figure looks too big or too small, that strip is the first place to look.
The gap: the call list
Before you have named anyone, this is simply every builder actively permitting in your territory. Actively permitting means three or more projects in the last 12 months that match your product lines, so a homeowner who pulled one permit on their own house is not on this list. The Filed in the last 90 days filter is on by default: that is the difference between a research list and a call list, and the full count stays beside it. Each row shows an estimate of the work in it for you. Export CSV takes the list to Monday's meeting. By area folds the same builders into zones, each scored 0–100 for opportunity and banded: expand, assign senior coverage, maintain, reduce effort. Open a zone's Why? and the score breaks into fit, gap, trend, volume and addressable, each with its number; Where your reps should be splits your rep count across zones by addressable spend. Team Flow routes by these same zones.
Read the line that starts "If you do one thing". It names the single builder with the most projects and the most of your lines in play. That is Monday's first call.
The file, under the list
Some of the builders on that list are already your customers, and the page cannot know which until you tell it. The card under the list asks for your customer list with what it buys stated: which of these builders are already yours, and how much of their work you are on. Account names are all it needs; a job or quote list with addresses also unlocks the leak. You can type a few names by hand instead. Once anything has landed, the headline becomes "You named 420 builders. There are 371 actively permitting in your territory right now", two share figures follow (your share of builders by count and your share of the work that is yours to quote by dollars), and the list becomes a real gap list: the builders you did not name.
Your accounts: the leak
The headline is the work at builders you already sell to that your own job list does not show you on, in your dollars. Under it: how many permitted jobs across how many of your accounts. BuildMapper cannot see who supplied those jobs. A permit names the builder, never the supplier. So this is work you were not on, not work you lost, and the page says so. If you gave a job or quote list, a second panel shows how much of each account's work you are on. Your accounts that are already fully covered sit collapsed under Already yours.
Per rep, and Ask
When your customer file carried a rep column, Your accounts gains a tab per rep, because BuildMapper never guesses who owns an account from geography. From there, Email this report sends a rep their accounts, what they are not on, and one goal for the quarter with the arithmetic shown, and no ranking against other reps. Rep coverage across the whole team lives in Team Flow's Performance tab. Ask, the button in the header, is a chat over these results ("which of my accounts in Penticton filed something this month?"); its answers come from the same numbers on the page, never from memory. The market-context notes at the foot of the gap tab are web research and are labelled as not permit data.
Drill through everything
Every number is a link. Click it and the permits behind it open: address, builder, project type, permit reference, filed date, status, and your estimated share above the project's full cost. If a figure ever opens to nothing, that is a bug, not an empty territory, and the page says so.